

Description
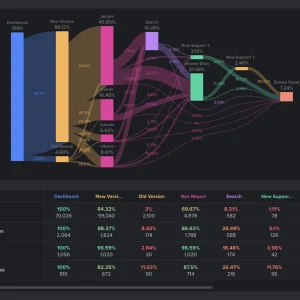
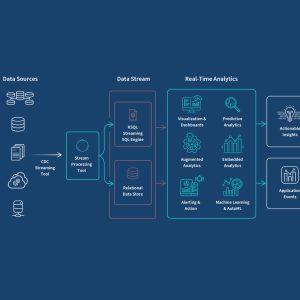
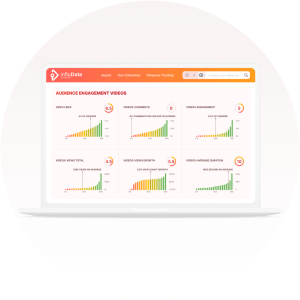
Custom dashboard development empowers organizations to visualize data in ways that are both intuitive and strategic. Using leading tools such as Microsoft Power BI and Tableau, we design dashboards that provide real-time, multi-source analytics in one unified interface. Our process begins with a stakeholder consultation to understand the key performance indicators (KPIs), business goals, and data pain points. We then connect various data sources—CRMs, ERPs, cloud databases, spreadsheets, or APIs—and clean, structure, and model the data. Once the data layer is optimized, we begin crafting visual elements like charts, filters, slicers, maps, and tables. We emphasize design thinking to ensure the dashboards are easy to interpret, mobile-friendly, and aligned with your brand’s aesthetics. Dashboards are role-based and secure, offering personalized views to executives, managers, and analysts. With automated refreshes, alert systems, and drill-down capabilities, our dashboards eliminate the need for manual reporting and help organizations make timely, data-driven decisions. From sales and marketing to HR and operations, every team benefits from transparent, interactive analytics.


Habiba –
“The custom dashboards developed using Power BI are fantastic! They’ve completely transformed how we understand and use our data. The visualisations are clear, insightful, and perfectly tailored to our business needs, enabling faster and more informed decisions. This service has been invaluable in improving our business operations.”
Abosede –
“The custom dashboards created were exactly what my business needed to take data analysis to the next level. The interactive visuals are clear, concise, and provide real-time insights that have already helped me make more informed decisions. He really understood my requirements and delivered exceptional value.”
Kabiru –
“The custom dashboard development transformed how I understand and run my business. The visuals created using Power BI were intuitive and precisely what I needed to monitor performance and make informed decisions. It’s streamlined my ability to access real-time insights and has significantly improved my operational efficiency. I’m extremely pleased with the results!”
Bolaji –
“The custom dashboards built using Power BI and Tableau have revolutionized how we understand our business data. The visual stories crafted are incredibly insightful, providing a clear view of key performance indicators and facilitating informed decision-making at every level. This service has significantly improved our performance monitoring and overall efficiency.”
Patricia –
“The custom dashboards developed using Power BI have transformed how we understand our data and run our business. They provided exactly what we needed: clear, concise visualizations that allow for data-driven decisions. The service was excellent, resulting in impactful and visually appealing tools for executive oversight and performance tracking. This has significantly improved our efficiency and ability to make informed choices.”